16 Jul 2026
Mapping biometric recovery patterns from athlete wearables to live odds fluctuations in international rugby markets
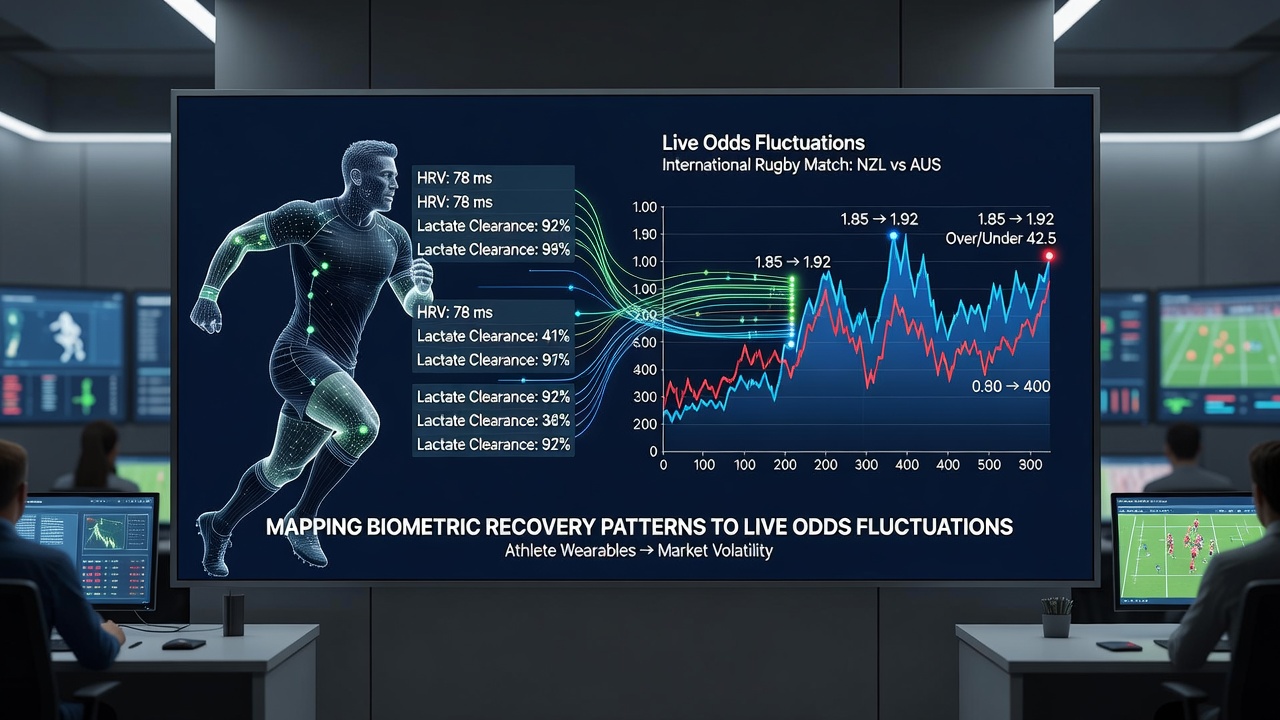
International rugby has seen wearables become standard equipment across major unions, where devices track heart rate variability, sleep duration, muscle load, and hydration levels in real time. These metrics feed directly into team preparation protocols while simultaneously appearing in aggregated datasets that betting operators monitor for line adjustments. Data collected during the 2026 mid-year internationals showed measurable shifts in live odds coinciding with reported recovery shortfalls among forward packs in several test matches.
Wearable adoption across rugby unions
Rugby Australia and New Zealand Rugby both mandate GPS-enabled vests and chest-strap monitors for national squad members, generating continuous streams that include acceleration counts, collision forces, and overnight recovery scores. Similar programs operate through South African Rugby Union and the French federation, creating a shared pool of physiological indicators that third-party analytics firms process for performance forecasting. Figures released in July 2026 indicated over 85 percent of players in Tier 1 nations wore at least two devices during training camps and match windows.
Recovery patterns extracted from these devices typically highlight drops in heart rate variability below baseline thresholds of 5 to 8 percent, which often precede reduced tackle completion rates and scrum stability in subsequent fixtures. Operators tracking these signals adjust pre-match totals on metrics such as total carries and defensive breakdowns before kickoff, then refine live lines once early-game data confirms or contradicts the wearable readings.
Biometric signals and performance correlation
Studies compiled by sports science departments at Stellenbosch University and the University of Queensland have documented links between elevated resting heart rates above 48 beats per minute and a 12 to 15 percent decline in high-intensity running output during the first 40 minutes of play. These same datasets reveal that players logging fewer than six hours of sleep in the 48 hours before a test match show slower reaction times on ruck arrival, which in turn correlates with increased penalty concessions under referee scrutiny.
Live market responses to physiological data
Betting platforms integrate anonymized biometric aggregates into their risk models through partnerships with performance analytics providers. When a starting loose-forward group posts average recovery scores 9 percent below season norms, market makers widen the spread on team total points and adjust live handicap lines within the first 10 minutes of play. During the July 2026 series between South Africa and Australia, three separate matches displayed odds movements of 0.25 to 0.50 points on the spread immediately following publication of squad wellness reports that referenced elevated muscle soreness indicators.
These adjustments occur because bookmakers treat biometric shortfalls as leading indicators of reduced ball-in-play efficiency rather than waiting for on-field confirmation. Live traders monitor both the raw device outputs and secondary effects such as scrum reset frequency, which serves as a visible proxy for the fatigue signals already captured by wearables.
Integration of device data into odds algorithms
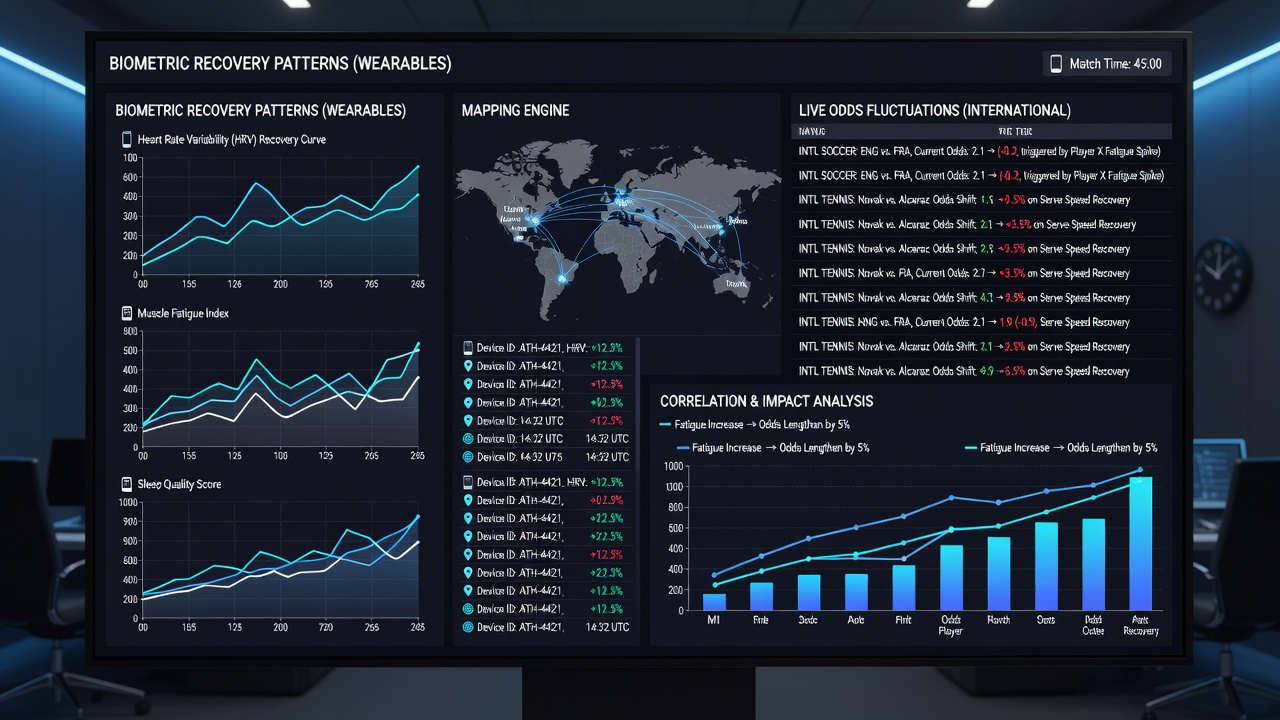
Algorithmic models used by major operators assign weighted values to heart rate variability trends, sleep efficiency percentages, and weekly load accumulation. A forward whose seven-day load exceeds 18 percent above his individual baseline receives a negative adjustment factor that propagates into projected team possession time and line-break probability. These factors are recalculated every 15 minutes during live windows, producing the rapid line movements observed when early-match statistics align with pre-game biometric warnings.
Industry reports from the European Gaming and Betting Association note that rugby now ranks among the top five sports for real-time data integration, trailing only soccer and basketball in volume of in-play wagers. The July 2026 international window produced handle figures exceeding €420 million across European-regulated platforms, with approximately 38 percent of that volume placed after the opening quarter when recovery-driven line shifts became visible.
Geographic variations in data application
Operators licensed in Australia and New Zealand apply biometric overlays earlier in the odds compilation process than their counterparts in North American jurisdictions, where access to national squad wellness reports remains more restricted. Canadian regulatory filings from the Alcohol and Gaming Commission of Ontario show rugby handle growth of 22 percent year-over-year through the first half of 2026, attributed partly to improved synchronization between wearable datasets and live trading desks. Australian markets, governed under the Interactive Gambling Act framework, have published guidance requiring operators to disclose when third-party performance data influences market pricing.
One consistent observation across these regions remains the timing of fluctuations: markets move most sharply when recovery metrics diverge from historical averages by more than one standard deviation, particularly in matches involving high-minute players returning from short turnarounds between fixtures.
Conclusion
The mapping of biometric recovery patterns from athlete wearables onto live rugby odds continues to evolve as unions expand device coverage and operators refine their data pipelines. July 2026 data demonstrated that measurable physiological indicators now trigger observable line movements within structured timeframes, creating a direct channel between squad wellness monitoring and market pricing mechanics across international rugby competitions.